
When companies think of improving their cash management process, accounts receivable may come to mind first. But its less-heralded counterpart, the accounts payable function, plays an equally crucial role in optimizing cash management. Not only does AP ensure that suppliers and business partners are paid in a timely manner—solidifying relationships and often allowing companies to capture discounts—but an effective function is critical to a company’s understanding of its financial position at any given time.
Companies can gain near real-time visibility into the AP process with an accounts payable metrics dashboard, which allows stakeholders to monitor the status of invoices, payments and outstanding liabilities. A dashboard is also beneficial in identifying operational bottlenecks and highlighting opportunities to optimize the process.
How dashboards keep companies on track
As the name suggests, an AP metrics dashboard is a dynamic visual display of key performance indicators (KPIs), metrics and trends that measure process performance. By automating key measures and putting the right metrics in front of the right people, the dashboard empowers companies to improve process effectiveness, leading to better cash flow and forecasting and increased profitability.
Other benefits of an AP dashboard include:
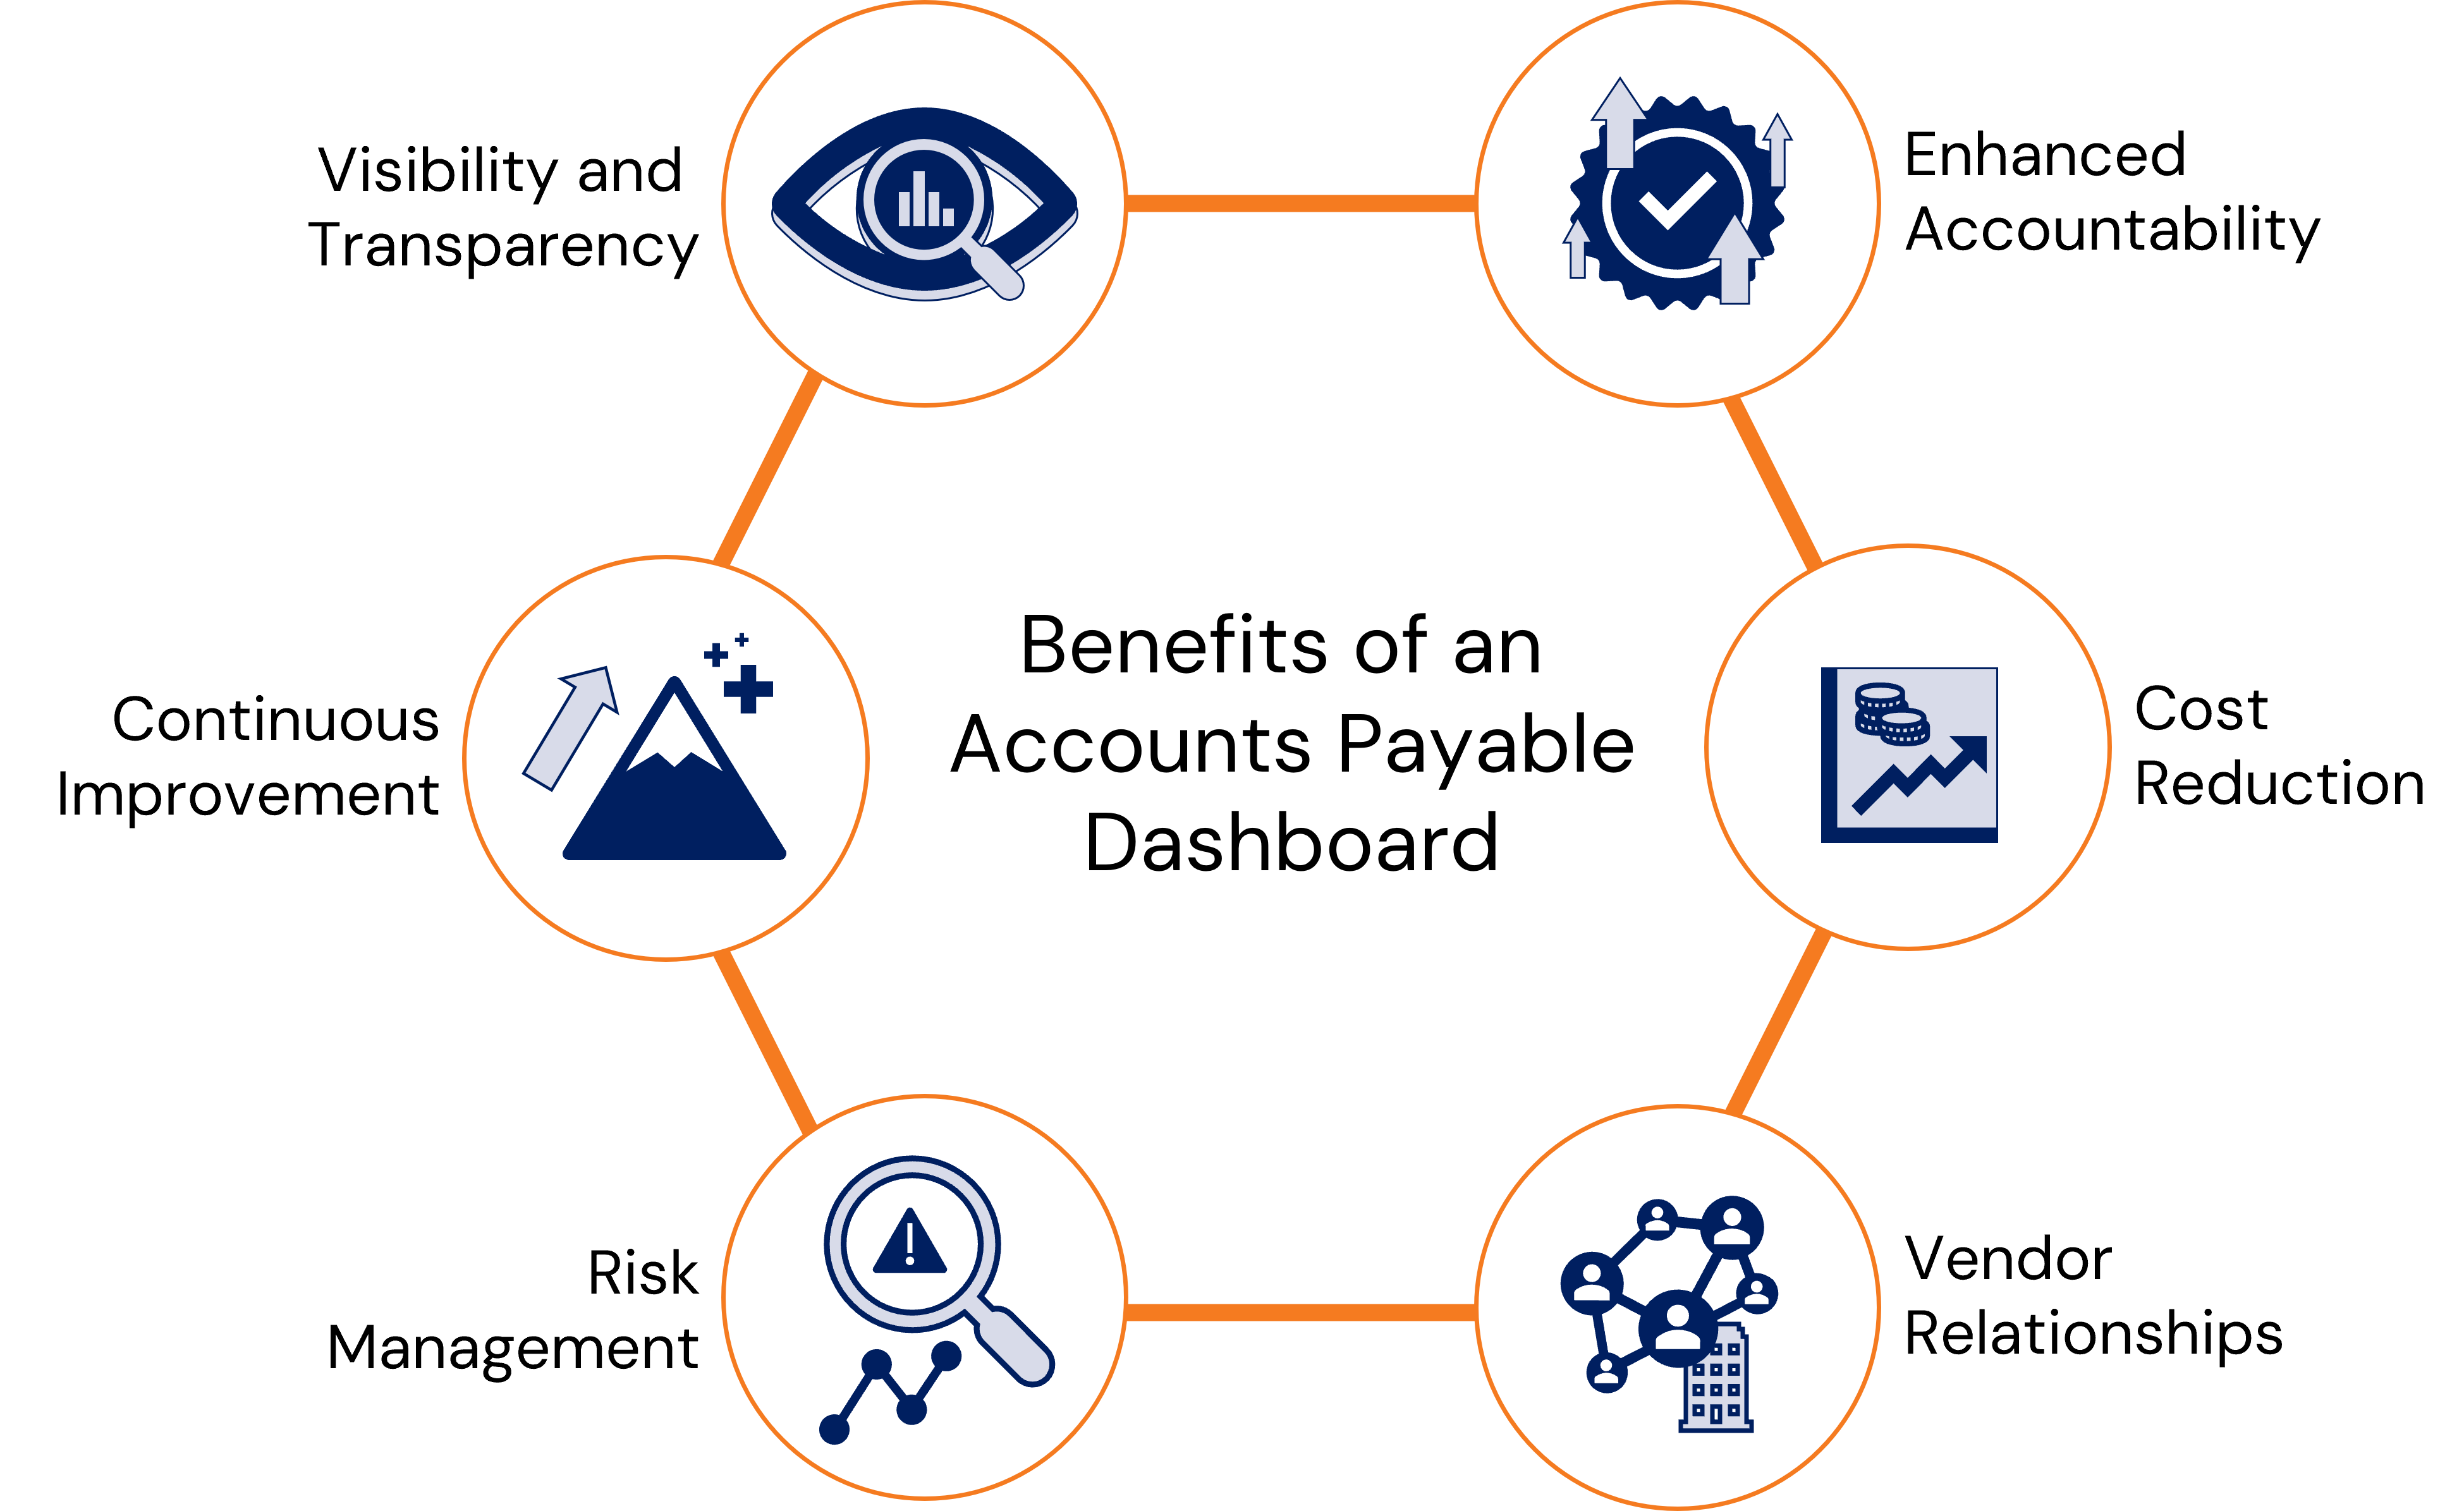

Visibility and transparency
Stakeholders get real-time insights into the status of invoices throughout the processing cycle, allowing users to swiftly identify overdue invoices, prioritize tasks and take measures to prevent delays.

Enhanced accountability
By highlighting key performance metrics related to individual and team performance, employees understand how their activities impact overall AP efficiency and are more likely to take ownership and meet targets.

Continuous improvement
Managers use data-driven decisions to identify opportunities to implement best practices and realize ongoing improvement.
Cost reduction
Companies can lower operational costs and boost profitability by reducing processing times, avoiding overdue penalties and improving efficiency.
 Risk management
Metrics such as overdue or duplicate payments, invoice accuracy and approval times help companies identify and address potential risks or compliance issues.

Vendor relationships
Monitoring metrics such as timely payments, captured vendor discounts and vendor satisfaction scores are key to ensuring strong relationships and favorable terms with vendors and suppliers.
Learn how we helped a global manufacturer implement an accounts payable dashboard to gain near real-time visibility into the performance of its AP operations.
Unlocking Performance Visibility with an AP Metrics Dashboard
Key AP metrics
The metrics and KPIs you select should be a mix of leading and lagging indicators based on predictive and historical metrics that provide a comprehensive view of AP performance. Leading indicators help identify potential issues before they escalate while lagging indicators measure past performance. The following is a list of key metrics related to AP productivity and invoice processing time:

Productivity
-
-
-
- Number of invoices processed per FTE
- Number of unprocessed invoices per FTE
- Percentage of invoices processed accurately
- Average invoice processing time
-
-

Invoice volume
-
-
-
- Number of invoices received per day
- Number of invoices received per week
- Number of invoices processed per day
- Number of invoices processed per week
-
-
Invoices on hold
-
-
-
- Number of invoices on hold by line-of-business (LOB)
- Dollars on hold by LOB
- Average days on hold by LOB by week
- Ratio of current to past due dollars on hold
- Oldest invoice on hold
-
-

Invoice approval time
-
-
-
- Days aging of invoices in approval
- Oldest invoice in approval
- Dollars in approval
- Days aging of invoices in approval
- Oldest invoice in approval
- Dollars in approval
- Approver with the highest unapproved balance
- Invoices with no approver
- Dollars in approval with no approver
- Average approval time
-
-

Vendor Performance
-
-
-
- On-time payment percentage
- Vendor discounts captured
- Percentage of invoices paid within contractual payment terms
-
-
By consistently tracking these metrics using an AP dashboard, companies can gain extensive visibility into AP performance, allowing them to optimize the function’s performance and improve their overall cash management practices.
Essential steps to developing an AP dashboard
- Determine key metrics
Identify relevant AP measures to track with the goal of improving invoice processing time. - Identify and validate data sources
Determine what data sources will be used in the calculation and development of the selected metrics. - Design dashboard structure
Decide on the dashboard’s design and functionality with easy visualization and user-friendliness in mind.
- Select dashboard tools
Advanced tools such as Power BI and Tableau offer robust capabilities for creating interactive dashboards; Microsoft Excel and Google Sheets are also effective for creating basic dashboards. - Develop data calculations
Develop calculations and formulas to derive selected metrics from the raw data; ensure accuracy and consistency with industry standards and internal policies. - Build prototype
Build, test and refine the dashboard prototype to visualize how the dashboard should look and function. - Integrate and set up data
Integrate data sources with the dashboard tool to automate data retrieval and ensure regular refreshes. - Define and implement user-access controls
Define and apply user access controls and security methods to manage dashboard access based on user roles and permissions. - Test and iterate
Conduct dashboard testing to validate calculations and data visualizations; identify areas for improvement. - Deploy and train users
Deploy the dashboard and conduct training; develop documentation consisting of detailed instructions, explanations and troubleshooting tips. - Monitor and maintain performance
Track user engagement, data accuracy, impact on productivity and invoice processing time; continually refine and improve.
Ready for next steps?
Although the AP function sometimes seems overshadowed by its more high-profile counterpart, the AR function, maintaining an effective accounts payable process is just as fundamental to understanding and ensuring your financial health, improving operational efficiency and fostering positive business relationships. Contact us if you’d like to discuss what more you can be doing to optimize your AP function.